
FEATURED RESULTS:
These are some selected works which members of GaLSSev have
conducted or contributed to. Major national and international
collaborations related to GaLSSev and associated with the works
featured below are highlighted in color, correspondingly. The
information on this page may be updated with some delay. Please
check regularly.


▲ ALMA CO (2-1) observations of the
molecular gas in z~1.6 cluster galaxies from the SpARCS survey
allowed the gas kinematic to be resolved. The resulting kinematic
maps were analyzed to determine their degree of asymmetry. Two
quantities are calculated to characterize this. On one hand, Avel
provides a measure of the amount of asymmetry in the rotation
curve with respect to the minor axis. On the other hand, Δ
χ2reduced quantifies the difference in
goodness of fit when two parabolas are fit to the receding and
approaching sides of the galaxy, respectively, and then the same
fit is compared with the oposite side of the galaxy. See Cramer et
al. (2023) for more details on how these quantities are
calculated. The results for the cluster galaxies in our sample
(green solid circles) are compared with estimates for simulated
field galaxies (orange symbols). While a linear relationship is
observed between Avel and Δ
χ2reduced, cluster galaxies are on
average more kinematically asymmetric than field galaxies. This
suggests the influence of dense environments on the evolution of
galaxy properties being already at play at high redshifts. Figure
taken from
Cramer
et al. (2023). Work in collaboration with
SpARCS/GCLASS.

▲ The quenching effect of the cluster
environment at z~1 on galaxies as shown by state-of-the-art,
cosmological hydrodynamical simulations. The simulations
considered are MACSIS/BAHAMAS, EAGLE/Hydrangea, and
TNG300. Environmental quenching is quantified in terms of the
quenched fraction excess (QFE), a measure of the amount of
quenching in clusters relative to the field. The QFE from
simulations is compared with that from real data at z~1 coming
from the GOGREEN survey (clusters) and COSMOS/UltraVISTA
(field). The simulations struggle to reproduce the observed
variation of the QFE as a function of stellar mass, producing a
significantly larger fraction of quenched, low-mass
satellites. Some of the simulations also fail at sufficiently
quenching cluster galaxies at the high-mass end, perhaps due to
insufficient AGN feedback. The origin of the discrepancy shown at
low stellar masses is not clearly understood, something to be
studied in more depth with the next generation of simulations. See
Egidijus et al. (2023) for details. Figure taken from
Egidijus
et al. (2023). Work in collaboration with
GOGREEN and SpARCS/GCLASS.
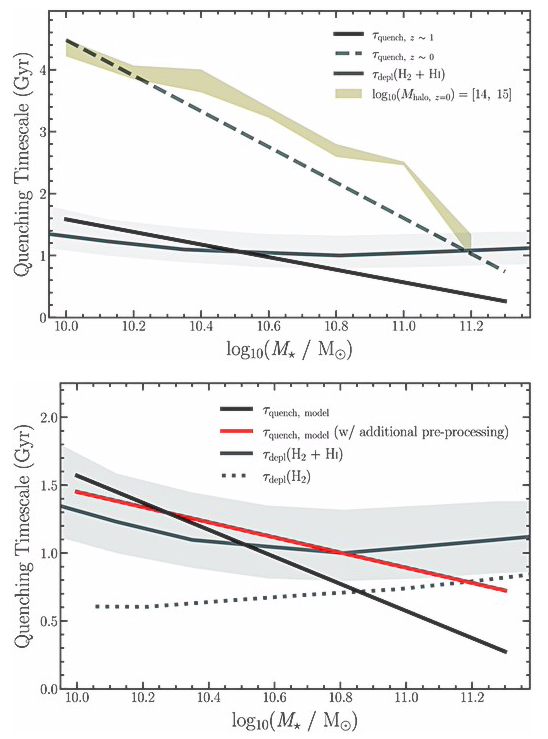
▲ The satellite quenching time-scale in
massive galaxy clusters at z≳1 as modeled by combining data
from the GOGREEN and GCLASS surveys with the IllustrisTNG
simulation. The fiducial model, parameterized by the satellite
quenching time-scale, τquench, successfully
reproduces previous observations from GOGREEN and GCLASS data,
namely the observed satellite quenched fraction as a function of
stellar mass, projected cluster-centric radius, and redshift. It
is also consistent with the observed field and cluster stellar
mass functions at z ~ 1. The resulting τquench is
mass dependent, decreasing with increasing stellar mass at least
in the M* > 1010 M⊙ mass
range, being roughly consisten with the total cold gas depletion
time-scales at intermediate redshifts (top panel). This suggests
that starvation may dominate the environmental quenching of
galaxies at z<2. Moreover, while the environment is relatively
efficient at quenching massive satellites, the additional action
of pre-processing makes τquench values less
dependent on satellite stellar mass and more consistent with the
estimated cold gas depletion time-scale at z~1-2 (bottom
panel). See Baxter et al. (2022) for details.
Figure adapted from
Baxter
et al. (2022). Work in collaboration
with GOGREEN and SpARCS/GCLASS.

▲ Physical properties (stellar mass, SFR,
sSFR, virial mass) of brightest cluster galaxies (BCGs) at 0.05 <
z < 0.42 as a function of cooling time and spectroscopic
redshift. This study was conducted using SDSS (optical) and WISE
(IR) data. The strong, weak and none cool core regimes are
indicated by the vertical lines: left of the red line, between the
lines, and right of the blue line, respectively. The results
indicate that the fraction of star-forming BCG galaxies is higher
at higher redshifts with SFRs being higher at higher redshifts than at
lower redshifts. The fraction of star-forming BCGs varies from 30%
to 80% in the above redshift interval. However, only a 13% of them
is located on the field Main Sequence at the same
redshift. Correlations with virial mass, stellar mass and cooling
time suggest the star formation in BCGs is mainly related to the cooling
of the ICM, although AGN heating of the ICM is also
present. Comparison with empirical models for the SFR evolution
with redshift shows that a transition merger- to cooling-dominated
star formation may happen at z<0.6.
Figure taken from
Orellana-González
et al. (2022).
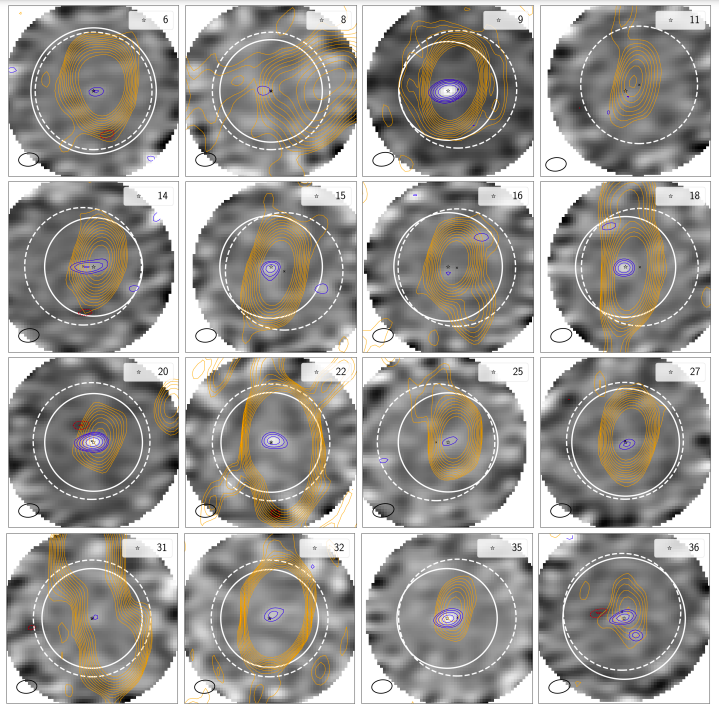
▲ ALMA ACA 1.3 mm maps (gray scale) of 16
sources with a >3σ central emission detection closer than
3.5 arcsec from a IR counterpart (see Messias et al. for
details). Each panel is 1 arcmin a side. The ACA observations
targetted 36 radio AGN candidates at 0.2 < z < 4.2 within 3.9
square degrees in the ELAIS-S1 field. This work presents the
survey and preliminary results. Sixteen of the targets show a
detection in the mm regime. In 8 of these, the emission has a
non-thermal origin. ACA can be used as a survey machine of the gas
and continuum properties of the most luminous high-redhisft radio
galaxies. The detection of negative continuum features near 4 of
the ACA maps (see Messias et al. for details) may be due to
either calibration systematics or the kinematic SZE of gas clouds
moving away from the observer. Whereas the former is unlikely for
this survey, the latter requires extreme gas conditions. Further
observations are needed to obtain a better understanding of the
reality of these features.
Figure taken from
Messias
et al. (2021).

▲ The redshift evolution of the spatial
extent of the current star formation in comparison with the
spatial extent of the integrated star formation history (stellar
continuum), R[Hα/C], of galaxies as a function of
environment (see Matharu et al. for details). Different symbols
correspond to different measurements from the literature as
indicated in the figure. The results from this work are obtained
from HST/WFC3 grism data of GCLASS clusters at z~1. The WFC3 data
are used to produce the first spatilly resolved Hα maps of
star-forming galaxies in clusters at that redshift
(see www.gclasshst.com for the
data release). The measurements indicate that R is smaller in
clusters by 6±9%, statistically consistent with the field
within 1σ. This negligible difference is at odds with the
high quenched galaxy fraction in clusters with respect to that in
the field. This can be reconciled if environmental quenching is a
fast process. When carrying out this analysis on recently
quenchend cluster galaxies, also known as post-starburst galaxies
(PSB), the R value is about 80% smaller in PSB than that in
star-forming galaxies in the field at similar redshift. This
result suggests that the star formation is truncated in a
outside-in manner in clusters at z~1, likely due to ram-pressure
stripping, in a way that is more rapid or efficient than that in
cluster at z~0.5 or lower. The effects on R would thus become
observable shortly after the galaxy is quenchend in the cluster.
Taken from
Matharu
et al. (2021). Work in collaboration with
SpARCS/GCLASS.
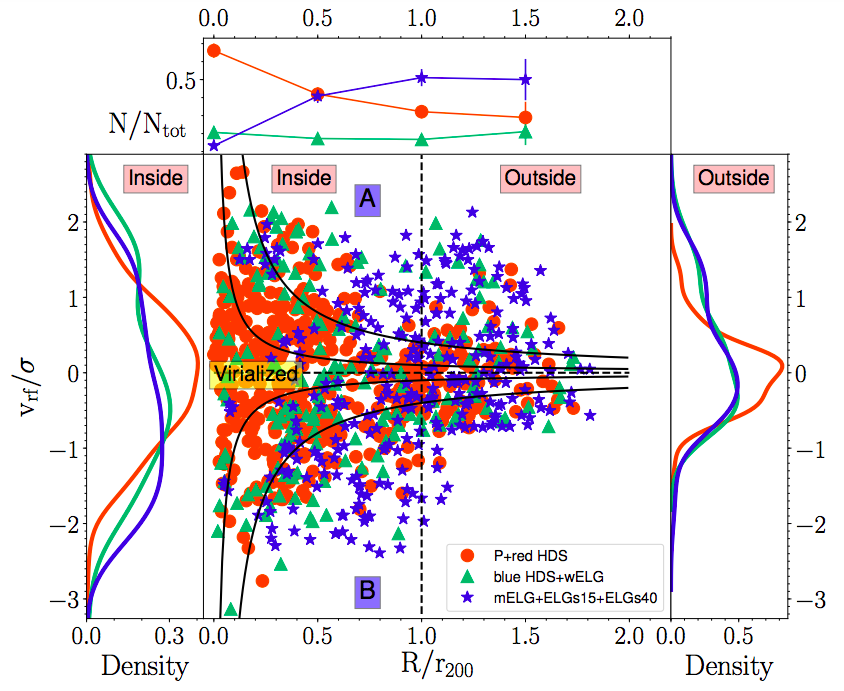
▲ Projected phase space diagram showing the
distribution of member galaxies in Abell S1063 from CLASH-VLT
observations. The distributions in clustercentric distance and
velocity are also shown. Different colored symbols and curves
correspond to different galaxy types classified according to their
spectral features, namely the equivalent widths of [OII], [OIII]
and Hα in emission, and Hδ in absorption (see Mercurio
et al. for details). Also, different cluster regions of interest,
such as virialized, backsplash, and infall are also shown (see
Mercurio et al. for details). The detailed analyses of the data in
hand indicate that low-mass quiescent galaxies are incorporated
into the cluster earlier than high-mass galaxies, suggesting that
the observed passive galaxies are low-mass galaxies that were
accreted early as blue galaxies. The results also indicate that
red galaxies move on more radial orbits, which can be explained if
infalling galaxies remain blue by moving on tangential orbits,
having time to quench their star formation within the cluster.
Figure taken from Mercurio
et al. (2021). Work in collaboration with
CLASH-VLT.

▲ The mass dependence of the fraction of
star-forming galaxies in the field that need to be quenched to
reproduce the observed stellar mass function of quescent galaxies
in GOGREEN. Eleven GOGREEN clusters with masses ~2 ×
10 14 M☉ and in the range 1 < z < 1.4
are used in this study (see McNab et al. 2021 for
details). Although uncertainties are lage, the oservations are
consistent with an escenario where the most massive passive
galaxies in the clusters are quenched before cluster accretion,
via pre-processing in group or protocluster environments. When
considering low-mass galaxies, on the other hand, about 20-30% of
star-forming cluster galaxies are quenched every 1 Gyr, in excess
of field expectations. A rapid (<1 Gyr) quenching process can
explain most of the low-mass excess of passive galaxies in the
clusters.
Figure taken from McNab
et al. (2021). Work in collaboration
with GOGREEN and SpARCS/GCLASS.

▲ The number fraction distribution of
quiescent galaxies in GOGREEN clusters and in the field as a function of
the observed axis ratio, q, for different stellar mass
intervals. Quiescent galaxies are selected according to their
location in the rest-frame UVJ color-color space. A set of models
is constructed to find the triaxial galaxy population that
best-reproduces the observed distribution of q values. The model
population assumes Gaussian ellipticity and triaxiality
distributions, and three scenarios with different ssumptions are
considered (as indicated by the curves; see Chan et al. for
details). The median value of q of both star-forming and quiescent
galaxies in clusters increases with stellar mass, in a similar
manner to field galaxies. By using oblate and triaxial components,
the modelling shows that there is an excess of quiescent galaxies
with flattened oblate morphology relative to the field. The
results from this work suggests that environmental quenching
produces a cluster popultion with a different morphological mix
than that resulting from quenching in the field.
Figure taken from Chan
et al. (2021). Work in collaboration
with GOGREEN and SpARCS/GCLASS.

▲ Difference in average formation time
between groups and clusters in GOGREEN and the field for quiescent
galaxies. See Reeves et al. (2021) for technical details. Data
estimates are compared with model predictions, with and without
pre-processing (see also Webb et al. 2020). The simple model
without pre-processing appears to be ruled out by the younger age
of quiescent galaxies in groups than in clusters. Note that the
stellar mass dependence of the formation time in the models is
weak, but becomes stronger on halo mass for the no pre-processing
model. This work supports models in which environmental quenching
becomes important for group-size halos at z>1. Figure taken from
Reeves et al. (2021). Work in
collaboration with
GOGREEN and SpARCS/GCLASS.

▲ Morpho-kinematical analysis of two AGN in
the cluster of galaxies RXJ0152-137 at z=0.84. The figure shows
the angular distribution of the Halpha and [NII] emission of AGN
ID=557 in flux, velocity, velocity dispersion and signal-to-noise
ratio (from left to right). The data were obtained with KMOS at
the ESO VLT whose footprint is also shown (first column). This AGN
is located in the central region of the cluster, possibly
interacting with a nearby galaxy, whereas the other AGN (ID=300)
is found in the outskirts of the cluster. The observed differences
between both AGN suggest that the cluster environment may be a
significant contributor to the processes that established the
properties of both cluster member galaxies. Figure taken from
Paillalef
et al. (2021).

▲ Velocity anisotropy profiles for
diffetent subsamples of galaxies in the GOGREEN clusters of
galaxies at z~1.2. See Biviano et al. (2021) for technical details
and definition of the samples. Although cluster mass does not seem
to affect the kinematical anisotropy distribution of the overall
cluster galaxy population, some trends can be seen with respect to
redshift, stellar mass, and star formation activity of
galaxies. The analisys of the galaxy velocity anisotropy
distribution indicates that the internal dynamic of clusters in
GOGREEN is similar to tha of clusters at lower redshifts. This is
also in agreement with anisotropy predictions from
simulations. All in all, GOGREEN clusters have reached an advanced
stage of relaxation by the observed epoch. See
Biviano
et al. (2021). Work in
collaboration with
GOGREEN and SpARCS/GCLASS.

▲ The first public data release of the
GOGREEN and GCLASS surveys of cluster galaxies at 0.8 < z
< 1.5. The data come from both photometric (full optical and
NIR wavelength coverage) and spectroscopic (optical) observations
with major telescope from the ground and space of 26 overdense
structures ranging in halo mass from groups to clusters of
galaxies. The final spectroscopic catalog includes 2,771
redshifts, of which 2,257 are reliable. A total of 1,704 objects
have redshifts within the above interval, with about 800 of them
being confirmed as cluster members. This data release includes
fully reduced images and GMOS spectra with catalogs of advanced
data products. See Balogh et al. (2021) for more details. Taken
from
Balogh et al. (2021). Work in
collaboration with
GOGREEN and SpARCS/GCLASS.

▲ Cluster galaxies in Coma identified by a
phylogenetic analysis to be part of a population with a
similar abundance pattern. The spectrum of each galaxy is used
to measure line indices to determine element abundances. Pairs
of galaxies are compared and a chemical distance between them
is determined to construct a phylogenetic tree. Tree
structures composed of galaxies with short chemical distances
among themselves in comparison with other galaxies in the
sample are named branches. Each branch represents an
individual population of galaxies with chemical
similarities. The galaxies shown in the figure correspon to a
population of early-type galaxies in the red sequence of the
Color-Magnitude diagram of Coma. The numbers indicate the
"chemical length" between the nodes of the branch. The results
from this work show that a phylogenetic approach can be a
powerful complementary, yet independent tool to more
traditional photometric analyses to study the evolution of
galaxies. The color stamps in the figure were taken from the
SDSS SkyServer DR15. The numbers indicate the "chemical
distance" of galaxies to nodes in the branch.
Figure taken from Monserrat Martinez's M.S. thesis, Univ. de
Concepción (2020). See Martínez-Marín
et al. 2020. Work in collaboration with UdeC's
astroinformatic group.

▲ Median star formation rate vs stellar
mass distribution of field and cluster galaxies at z~1.6 from the
SpARCS/GCLASS survey compared with similar measurements from the
literature. Star formation rates are derived from H-α
measurements in MOSFIRE spectra obtained for galaxies in three
clusters, and for galaxies identified serendipitously in the field
at similar redshifts. The distributions of star formation
rates in cluster and field galaxies at z~1.6 show no significat
difference from each other, and are also consistent with
other works at similar redshifts, suggesting that cluster galaxies
may have been accreted only recently as to show any significant
environment quenching. Other possibility is that at those
redshifts, cluster environments are too young, dynamically
speaking, as to be able to produce significant environmental
quenching effects on their galaxy populations relative to the
field. Taken from
Nantais et al. (2020). Work in
collaboration with
SpARCS/GCLASS.

▲ Stellar masses and mass-weighted ages for
cluster (in red) and field (in blue) galaxies in the GOGREEN
survey. Galaxies are grouped in bins according to their stellar
mass (see Webb et al. 2020 for details). The age distributions
shown indicate that although there are field galaxies as old as
the oldest cluster galaxies, and cluster galaxies as young as the
youngest field galaxies, field galaxies exhibit, on average, more
extended star formation histories to get the same final stellar
mass. The difference in mass-waited ages between cluster and field
galaxies at those redshifts (0.8 < z < 1.5) is about 0.3
Gyr, consisten with zero within the errors. Simple quenching
models using environmental quenching without pre-processing or
different formation times cannot reproduce simultanously that
average age difference and the measured quenchend fraction of
galaxies. This is distinctively different from what is observed in
local clusters, which suggests that galaxy quenching at high
redshifts is driven by processes different from those in the local
universe. Taken from
Webb et al. (2020). Work in
collaboration with
GOGREEN.

▲ Stellar mass functions (SMFs) of
quiescent and star-forming galaxies in cluster and field
environemnts are determined from the extensive spectroscopic and
photometric observations of the GOGREEN survey at 1.0 < z<
1.4. More than 500 hours of spectroscopic and imaging observations
were invested to study the SMFs down to a stellar mass limit of
109.5 - 9.7 M☉. While the cluster
environment is observed to have a significant quenching efficiency
at those redshift, with stellar mass-dependent values as low as
30%, the shapes of the SMFs of star-forming and quescent galaxies
across environments, however, are the same to a high statistical
precision. Nevertheless, the total SMF shows a deficit of low-mass
galaxies in clusters relative to the co-eval field. These results
are different from findings in the local universe, indicating that
a different quenching mode operates at high redshift. Taken from
van
der Burg et al. (2020). Work in collaboration with
GOGREEN.

▲ The stellar mass-size relation for
cluster galaxies in the GCLASS survey. In the main panel to the
left, colors indicate galaxy morphology as encoded in the
Sérsic index, n. Spectroscopically confirmed post-starburst
galaxies (PSBs) are shown as large squares. Low-confidence
spectroscopically confirmed PSBs are indicated with large
diamonds. All other cluster members are indicated as small
circular points. Objects below the stellar mass completeness
limits are shown as open symbols. Solid black lines correspond to
the expected field relations at z~1 obtained from the 3D-HST field
sample relations for star-forming and quiescent galaxies. Cluster
PSBs at z~1 follow a stellar mass-size relation that is in between
the star-forming and quiescent field relations. This suggests that
changes in the mass-to-light ratio gradient in galaxies are at
play. A combination of "outside-in" fading from star-forming
galaxies and a size growth of quiescent galaxies both from
quenching and dry minor mergers may explain the
observations. Taken from
Matharu
et al. (2020). Work in collaboration with
SpARCS/GCLASS.

▲ Projected cumulative mass (left) and mass
density (right) profiles obtained from weak lensing analyses of
CLASH clusters using extensive CLASH-VLT spectroscopy. The
profiles are rescaled by M200 and R200, and
the vertical lines mark the distance of spectroscopically
confirmed families of images from the cluster centers. The
rescaled projected total mass and mass density profiles have very
similar shapes, and the mean projected mass values measured within
10% of R200 present a small scatter of 5%. The large
number of high redshift galaxies and the precise magnification
maps obtained represent a valuable addition to the sample of
high-quality gravitational telescopes available to explore the
distant universe. Taken from
Caminha
et al. (2019). Work in collaboration with
CLASH-VLT.

▲ Galaxy images from the CLASH survey
observed in different filters and the corresponding morphological
(S: spheroid; D: disk; I: irregular; PS: point source; U:
unclassifiable) probabilities as determined by a convolutional
neural network model. This model has been trained using CANDELS
observations in the same filters and morphologies determined
visually by human classifiers. This method, as opposed to training
directly over the CLASH data, showed to be more efficient and
achieved a better performance. This approach is useful to minimize
visual classification efforts when classifying unlabeled massive
datasets from new surveys such as the LSST. Taken from
Pérez-Carrasco
et al. (2019). Work in collaboration with UdeC's
astroinformatic group.

▲ Evolution of the cumulative fraction of
quenched galaxies in the 10 most massive (C-1 through C-10) galaxy
clusters from the EAGLE simulation. The time scale is shown with
respect to the time of infall, tinfall, at which
galaxies cross the cluster's R200. The color bar
indicates the total mass of the cluster at z=0. Between 20% and
60% of galaxies arrive already quenched to the cluster which
highlights the role of pre-processing. This fraction depends on
final cluster mass, being larger for more massive clusters. Also,
the steeper slope at t=tinfall indicates the more rapid
increase of the quenched population at infall more than at any
other epoch. Taken from
Pallero
et al. (2019). Work in collaboration with
GaTOS.

▲ The redshift evolution of the
faint-to-luminous ratio, Nfaint/Nlumin, of
red-sequence galaxies in clusters belonging to the GOGREEN
Survey. The ratio is derived from the red-sequence Luminosity
Function down to M*H + (2.0-3.0). A
consisten analysis was also carried out for UltraVISTA field
galaxies. The faint-to-luminous ratio in clusters decreases with
increasing redshift and becomes consistent with field values at
z~1.15. The results indicate that the buildup of faint
red-sequence galaxies occurs gradually and suggest that faint
cluster galaxies already experience environmental quenching at
z~1.15. Taken from
Chan
et al. (2019). Work in collaboration with
GOGREEN.

▲ The cluster versus field stellar
mass-size relation and the size growth of passive cluster galaxies
as a function of redshift since z~1. The cluster galaxy sample has
been drawn from the SpARCS/GCLASS survey. Redshift, stellar masses
and sizes have been derived from Gemini/GMOS and HST/WFC3
spectroscopy, and HST/WFC3 imaging. The analyses show evidence
that the cluster environment inhibits size growth between z~1.5
and z~1.0, and that subsequent size evolution of quiescent cluster
galaxies is in part driven by minor mergers, together with other
cluster-specific processes. Taken from
Matharu et
al. (2019). Work in collaboration with
SpARCS/GCLASS.

▲ Offset from the Main Sequence as a
function of gas fraction for galaxies in z~1.6 clusters resolved
in CO(2-1) with ALMA. The scaling relation for field galaxies
(Genzel et al. 2015), normalized to z=1.6 and at several stellar
masses covering the mass range of the cluster sample, is also
shown (dashed blue lines). See Noble et al. (2017, 2019 [this
work]) for details. Cluster galaxies show typical main-sequence
star formation rates and massive molecular gas reservoirs situated
in rotating disks, similar to infalling field galaxies. However,
they also present elevated gas fractions, slightly smaller CO
disks, and asymmetric gas tails, suggesting tentative evidence for
gas stripping in z~1.6 clusters. Taken from
Noble et
al. (2019). Work in collaboration with
SpARCS/GCLASS.

▲ The Spitzer Planck Herschel Infrared
Cluster (SPHerIC) survey of galaxy overdensities with red IRAC
colors in the range [3.6]-[4.5] > -0.1. This color cut was
intended to select high-redshift protoclusters of galaxies. The
surface density distribution of IRAC red sources in SPHerIC is
indicated by the red histogram in the left panel. The photometric
redshift distribution of SPHerIC protocluster candidates obtained
from the IRAC color selection is shown in the right panel. The
hatched bars indicate the redshift interval where the
color-redshift relation utilized (see Martinache et al. [2018] for
details) is no longer effective. Taken from
Martinache et
al. (2018).

▲ Quenching timescale evolution with
redshift for groups and clusters of galaxies. The results from
this work, indicated by the red stars, were obtained from a sample
of clusters at z~1 and z~1.6. They suggest, together with results
from the literature, that kinematical quenching processes
(e.g. ram-pressure stripping) may dominate in the evolution of
high redshift cluster galaxies with stellar masses larger than
log(M*/M☉)=10.5, although gas-depletion
scenarios cannot be ruled out. See Foltz et al. (2018) for
details. Taken from
Foltz et
al. (2018). Work in collaboration with
SpARCS/GCLASS.

▲ Environmental quenching efficiency in two
CLASH-VLT clusters, MACSJ0416-2406 and MACSJ1206-0847, and their
substructures at z=0.4. The quenching efficiency,
εq, of substructures in the outskirts
(r>r200,cl) of clusters becomes comparable to that of
clusters. This suggests the existence of pre-processing in groups
associated with massive clusters of galaxies. Taken from
Olave-Rojas
et al. (2018). Work in collaboration with
CLASH-VLT.

▲ Oxygen abundance (top) and radial
velocity (bottom) maps of two star-forming dwarf galaxies, UM 461
(left) and Mrk 600 (right), observed with VLT/VIMOS-IFU. The two
galaxies show signs of morphological distortions, such as a
cometary-like structure. The properties of the spatially resolved
ISM in both systems are consistent with these galaxies being at
different evolutionary stages. In particular, UM 461's O/H
distribution shows indication of a recent infall of low-mass,
metal-poor material into the galaxy, consistent with the picture
through which galaxies form and grow via accretion of matter from
the surrounding environment. Taken from Lagos et
al. (2018).
See also this
astrobite article on this publication.

▲ Background-corrected morphological
fractions of red-sequence cluster members as a function of
absolute magnitude (left) and stellar mass (right). The different
panels correspond to different cluster surveys depending on
redshift, as indicated in the figure. The vertical dotted lines at
log (M*/M☉)=10.95 and and 11.5
indicate the stellar mass limit of the Hawk-I Cluster Survey (HCS)
morphological sample and the maximum stellar mass of red-sequence
galaxies in the HCS, respectively. Elliptical galaxies dominate in
HCS clusters at all stellar masses while the red sequence of local
clusters is dominated by ellipticals at log
(M*/M☉)>11.3 and by S0s at log
(M*/M☉)<11.3 (right). Disc-dominated galaxies
make up to 40% of red-sequence galaxies in the intermediate
redshift sample (left). Elliptical and S0 galaxies seem to follow
different evolutionary histories, with intermediate-luminosity S0s
likely resulting from the morphological transformation of
quiescent spirals. Taken from
Cerulo
et al. (2017). Work in collaboration with
HCS.

▲ The evolution in cosmic time of the
fraction of gas in cluster galaxies that are on the main sequence
of star formation. The field scaling relation for main-sequence
galaxies is shown by the black line and gray region. In general,
the gas fraction both in the field and in clusters increases with
redshift. Nevertheless, z>1 main-sequence cluster galaxies have,
on average, higher gas fraction than the coeval field. This
difference also tends to be larger than that in the low-redshift
universe. Taken from
Noble
et al. (2017). Work in collaboration with
SpARCS/GCLASS.

▲ An unusual case of an early-type
"jellyfish" galaxy in the galaxy cluster Abell 2670
(z=0.076). Observations with the MUSE instrument on the ESO VLT
made it possible to obtain an unprecedented view of the ionized
gas associated with the galaxy that is being affected by
ram-pressure stripping. Most likely, this galaxy, classified as
elliptical, acquired its gaseous component through a wet merger
with other galaxy. The figure shows the MUSE Hα (a) flux map
and (b) velocity offset map of the whole field of view. The
zoom-in areas for detected Hα blobs are indicated with boxes
(5(a) and (b)) in the Hα map. Taken from Sheen et
al. (2017).
Press releases associated with this work
include:
AAS
Nova, Phys.org,
I4U
News, The
Science Times, CEA, KASI,
and
YTN
Science (YouTube).

▲ Environmental quenching efficiencies as a
function of redshift for clusters and groups of galaxies. The red
symbol shows results from this study. Dash-dot lines connect
related studies and solid lines connect results from the same
study. Slight offsets between studies at the same redshift with
overlapping error bars have been added for clarity. Quenching
efficiencies appear to vary mostly by halo mass category (groups,
clusters). Within each halo-mass category, there are signs of a
decrease in environmental quenching efficiency with increasing
redshift. Halo mass growth together the time spent by a galaxy in
a cluster environment may lead to the observed trends at
z>1. Taken from
Nantais et
al. (2016). Work in collaboration with
SpARCS/GCLASS.

▲ Comparison between the red sequence
number counts in clusters and in the field. Black filled circles
represent the number counts of the entire Hawk-I Cluster Survey
(HCS) red sequence sample, while red diamonds are the red sequence
number counts in the WINGS red sequence sample. The number counts
of the HCS and WINGS composite samples were obtained as in Garilli
et al. (1999). Blue crosses are the red sequence number counts of
passive red sequence galaxies in the COSMOS/UltraVISTA field at
0.8 < z_phot < 1.5. The number counts in the WINGS and UltraVISTA
samples are normalized to match the value of the HCS number counts
at approximately the Schechter turn-over magnitude M*_V. Solid
lines are the best-fitting Schechter curves obtained for each
sample. While no deficit of galaxies is observed in HCS with
respect to WINGS, the UltraVISTA number counts decrease towards
faint luminosities. This result suggests that the build-up of the
red sequence is accelerated in clusters at low stellar
masses. Taken from
Cerulo et
al. (2016). Work in collaboration with
HCS.

