OBSERVATIONS FOR GALAXY EVOLUTION STUDIES:
A comprehensive and accurate description of galaxy evolution
requires the capability of obtaining high-quality (deep, high
resolution) spectrophotometric measurements of galaxies, as well
as detailed morphological information. All this information needs
also to be gathered for galaxies in different environments
(clusters, groups, filaments, field) and at different redshifts,
from as high a redshift as possible down to z=0.
Deep (≳M*+2), multi-band imaging is essential to
estimate photometric redshifts and calculate stellar masses (down
to ≳109 M☉) through Spectral
Energy Distribution fitting. An as-wide-as-possible coverage in
wavelength, from X-rays to the (sub-)millimeter, anables us to
obtain not only an accurate measurement of the above quantities,
but also a robust, correct assessment of the star formation rate
of galaxies, their ages, AGN activity, and dust content. X-rays,
UV, mid-IR and far-IR observations require space
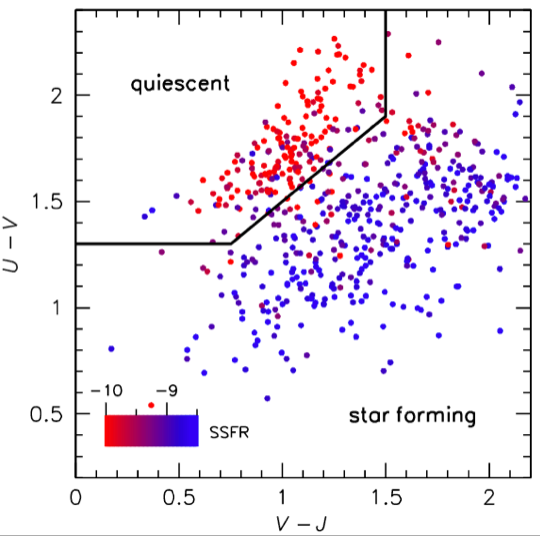
observatories. Color-magnitude and color-color diagrams, such as
the rest-frame UVJ plane (Fig. 1), have proven to be excellent
tools to separate galaxies according to their star-forming
activity and stellar population content, thus anabling effective
techniques to constrain the star formation history of
galaxies. Stellar masses and colors are simple yet effective
properties to study the environmental quenching of galaxies
through stellar mass functions, galaxy fractions, and the
corresponding measuramente of the quenching efficiency. The
latter can be measured at different redshifts to study the
star-forming evolution of galaxies as their local environment
builds up and evolve.
Despite accurate photometric redshift information, spectroscopic
redshifts are crucial to draw any reliable conclusion from any
galaxy evolution study. This is due to the far greater accuracy
(~0.1%) of spectroscopic redshifts compared with the accuracy
(~1-5%) of photometric redshifts. Spectroscopic redshifts are used
to establish the actual existence and structure of mass
overdensities in the unverse and their dynamical
state. Spectroscopy is the most powerful tool of astrophysics,
allowing us to quantify, in addition to the redshift, the
dynamical mass, chemical abundance, age, and stellar population
mix of galaxies, among others. Emission lines (e.g. [OII], [OIII],
[NII] Hα, Hβ) in the spectra of galaxies are typically
used to dermine their star formation rate and AGN contribution via
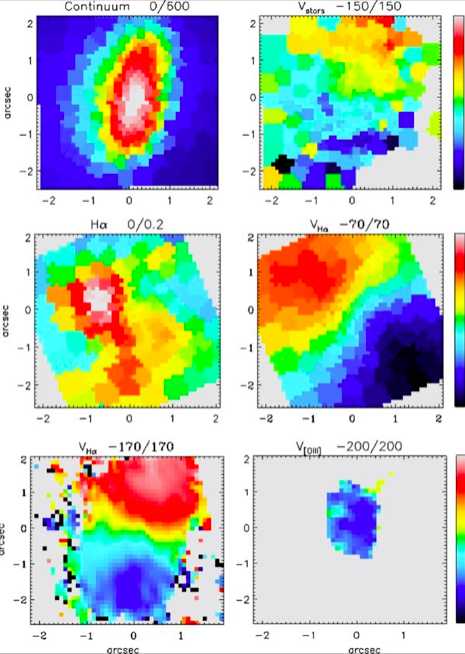
diagnostics such as the BPT diagram. The development of the
integral field spectroscopy technique (Fig. 2) has revolutionized
the field making it possible to map out the internal kinematics of
galaxies. Velocity and velocity dispersion field maps are used to
unveil the true internal structure of galaxies allowing us to
probe their past merger history and reconstruct their
evolution. Integral field spectroscopy allows us to distinguish
purely-totating from complex-kinematics disks, and uncover
decoupled cores as well as gas inflows or outflows in
galaxies. While optical and NIR spectroscopy provides information
on the hot, ionized gas component of the interstellar medium at
various redshifts, molecular line transitions (e.g. the CO ladder)
in the (sub-)millimeter allow us to determine the physical
conditions (density, temperature) of the cold, molecular gas
component. A combination of both spectroscopy and multi-band
photometry is, therefore, crucial to achieve the most complete and
accurate description of galaxies.
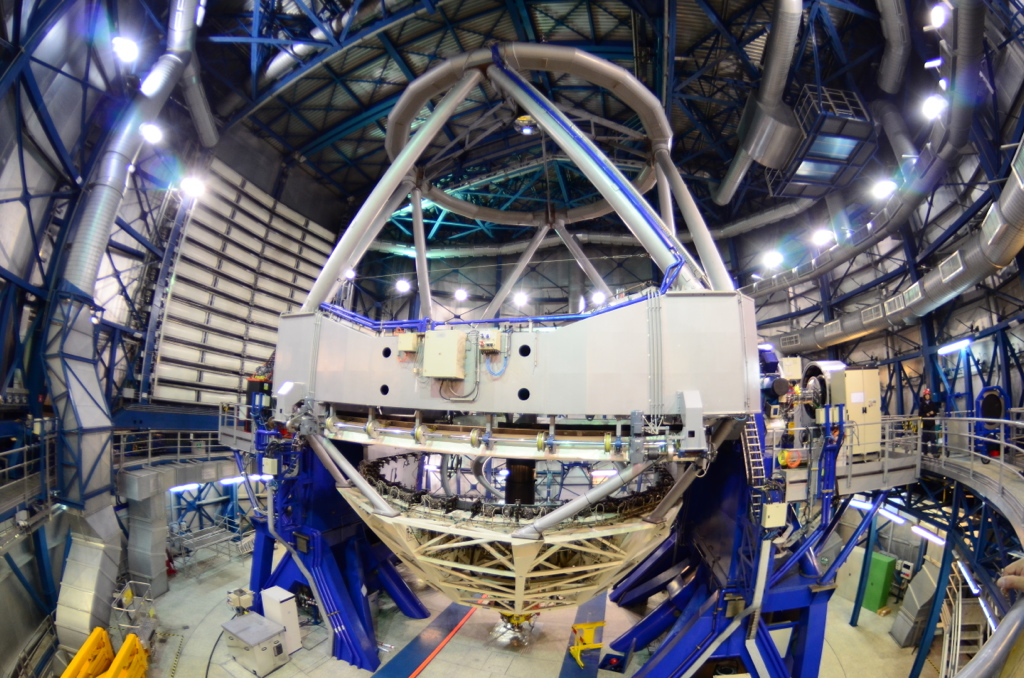
Today, the advances in technology, such as the Adaptive Optics,
makes it possible to achieve the diffraction limit of 10-m-class
ground-based telescopes for certain type of observations on a few
observatories (e.g. VLT, Gemini, Keck). Nevertheless, HST imaging
from space provides the most detailed and accurate determination
to date of the morphology of galaxies. Morphology is an essential
piece of information that can be used to trace the transformation
of galaxies, specially when it is utilized together with
information on the local environment such as galaxy density or
mass density. The latter can be determined also thanks to the high
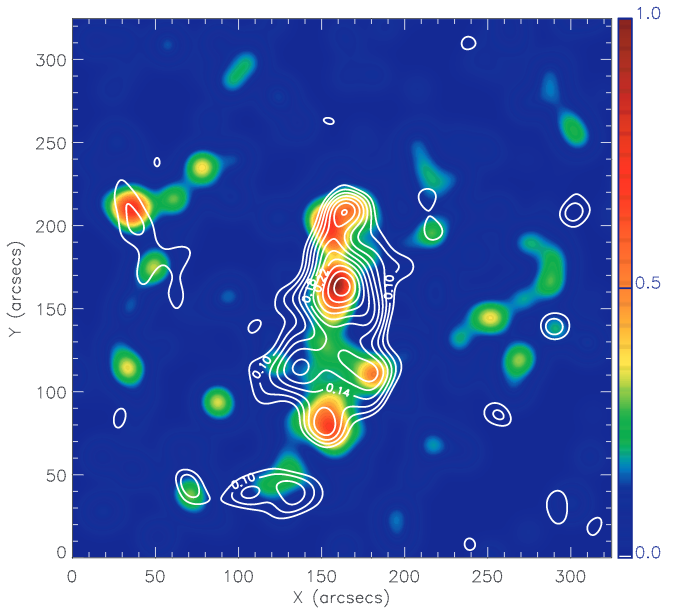
angular resolution images provided by HST. After correcting for
intrinsic distortions of the optical system, weak and strong
lensing analyses of galaxies in the observed field of view are the
most robust way of tracing the dark matter mass distribution and
overall mass content of large-scale structures such as clusters
(Fig. 3), groups and filaments of galaxies.
Members of GaTOS have access to a wide variety of high-quality
spectroscopic and photometric data obtained with space-
(e.g. Chandra, HST, Spitzer, Herschel, WISE) and ground-based
(e.g. VLT, Gemini, Magellan, ALMA, APEX) facilities covering the
full electromagnetic spectrum from X-ray to millimeter
wavelengths. The available data allow us to apply the above
observational techniques, and to probe various environments and
galaxy types distributed within about the last 10 Gyr of cosmic
history.